Statistics: the funnel, sources and what each number means
Statistics answers two questions: how many people got from the scan to a review and which medium brought them. It cannot answer the third - how many reviews actually appeared in Google - and below is why
The review funnel
The main card on the screen has four steps, each with a number and a share of views. It reads top to bottom: how many reached the next step
- Page views - how many times the review page was opened: via a link, a QR/NFC tag or manually
- Chose a rating - how many customers tapped a star
- Went to the review platform - customers with a high rating who tapped the button to go to Google
- Review in the form - those who wrote to you in the private form; usually these are low ratings
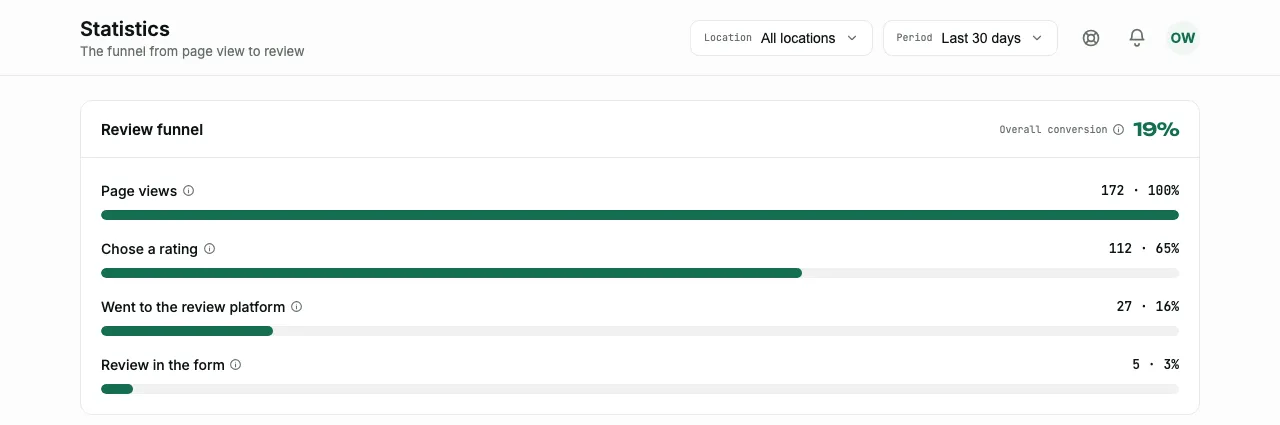
The card header has one more number - "Overall conversion". It is counted differently from the steps: it is the share of visitors who left a review anywhere - went to the platform or wrote in the form. That is the total for the whole funnel, while the steps below show which way people went
Next to each term on the screen there is an "i" icon with the same explanation - you do not need to look it up in the documentation if you forget what a step counts
Why there is no "wrote a review in Google" step
This is the most common question about statistics, and the answer is technical: after going to Google, the customer ends up on someone else's site. We see that they tapped the button, and that is where our visibility ends - whether they wrote a review, how many stars they gave and when, only Google knows
That is why the step is called "Went to the review platform", not "Left a review". Check the real growth in reviews against the counter in your Google profile - the funnel shows how many people you brought there
Conversion to review
Right under the funnel is a large line "Conversion to review" with the caption "How many out of a hundred who opened the page reached a review - on Google or in the form". It is the same number as "Overall conversion" in the funnel header, only spread out over time
Under the number is the change against the previous period of the same length, and it is counted in points, not in percent: "+3.1 pp" is added to the conversion itself, whereas "+11%" would read like a conversion
A day when the page was not opened even once shows "No data", not 0% - there is simply no conversion for such a day, and a zero on the chart would be an invented dip
Four small charts and CSV download
Below are four small charts, one for each funnel step: "Page views", "Chose a rating", "Went to the review platform" and "Review in the form". They answer a question the funnel itself does not show: when exactly it happened
Each chart has its own scale - this is stated right in its caption ("own scale · peak … per day"). Four silhouettes of the same height can stand for 1248 and for 43: you cannot compare them by eye, each is read on its own
The "Expand chart" button opens this step in full size: a "Chart" / "Table" view switch, a "Day" / "Week" interval switch and the totals "FOR THE PERIOD" and "DAILY PEAK"
With the weekly interval a second series appears - "Previous N days" - and a warning that the first bar is a partial week: weeks are counted back from today so that the last one does not look like a collapse
In "Table" view a "Download CSV" button appears - the only way to get the statistics numbers as a file. One metric at a time is exported - the one whose chart is expanded
When people scan
The last card before the tables is "When people scan": all views in the period grouped by hour of the day. The key point in the caption is that this is not a timeline but a typical day: forty views at 13:00 means forty over all days together, not forty today
There is one practical use: you can see the hours when customers really pick up their phones. If the peak falls at lunchtime and reminders about the QR code in the room start in the evening, the reminders should be moved
Traffic sources
The "Traffic sources" table answers the question that separate tags are made for: which medium works. Each row is its own source with its own views, visitors, ratings, average rating, redirects and conversion
- A named tag - a separate QR or NFC tag for a table, a window or a receipt
- Personal links - everything issued to customers by name
- General link - the main QR code or the page address
- Website - a visit through the button you added to your own business website (the "Distribution" screen); in the table it is labeled "?s=site"
- Instagram - a visit from the link you put in your social media profile; in the table it is labeled "?s=ig"
- Direct - a visit without a tag: the person opened the page from a bookmark or typed the address
Views and visitors are different columns with different numbers. One person who refreshed the page three times gives three views but one visitor. That is why conversion is better read together with visitors, not with views
Conversion in this table is the share of this source's views that ended with a redirect to the platform. This is how tags are compared with each other: a hundred views with 8% conversion are worse than twenty with 40%
Periods and locations
At the top of the screen are two filters: location (or "All locations") and period: the last 7, 30 or 90 days. There are no other values, and you cannot set a custom range
The views column in tags counts the last 30 days regardless of which period is selected here. These are different screens with different windows - do not be surprised by the difference in numbers
Below is the "By location" card: the same numbers broken down by site. It makes sense when there are several locations: you can see which one really collects reviews and which one only has a printed QR code
The whole screen cannot be exported as a report - neither as one file nor by email. What exists is the "Download CSV" button in the expanded chart, one metric at a time. If you need monthly history in one table, you will have to assemble it from these files yourself
How to read it
Three typical pictures and what they mean:
- Few views - the problem is not the page but the medium: the QR code hangs where it cannot be seen, or the link was never sent to anyone
- Many views, few ratings - people open the page and leave. Usually it is a long path: the link was sent in a messenger, and the customer got stuck in the built-in browser
- Many ratings, few redirects - the ratings are below the threshold. See the Reviews section: people write to you instead of Google, and that is exactly what the threshold exists for
If there is no data yet, the screen says so - "No data yet" with a suggestion to share your link. An empty funnel does not mean something is broken
Frequently asked questions
- How many reviews actually appeared in Google?
- Statistics does not know: after the redirect the customer is on Google's side, and we cannot see what they do. Check against the counter in your own Google profile
- Why is the average rating here lower than in Google?
- Here all ratings are counted, including the low ones that went to the private form. Only those above the threshold reach Google
- Can I pick a custom period?
- No, three values are available - 7, 30 and 90 days
- Can I export a report to a file?
- Partly. In the expanded chart, in "Table" view, there is a "Download CSV" button - it gives one metric for the selected period. Exporting the whole screen as one file, PDF and email delivery are not available